Just how many people left North Carolina in the first half of the nineteenth century -- and where did they go? To answer questions like this, the best place to turn is census records. The census can't tell us why people moved -- we'll explore their reasons on the following pages. But a look at the numbers can give us a sense of the scale of the migration.
Population growth
Before we start, it will help to list the reasons that the state's population might grow or shrink.
Sources of population growth include:
- births
- immigration (people freely coming from other states or from other countries)
- enslaved people brought by their enslavers from other states
- purchase of enslaved people from other states
- importation of enslaved people from Africa as part of the trans-Atlantic slave trade (before 1810)
Sources of population loss include:
- deaths
- emigration (people freely leaving the state)
- enslaved people taken by their enslavers to other states
- sales of enslaved people to other states
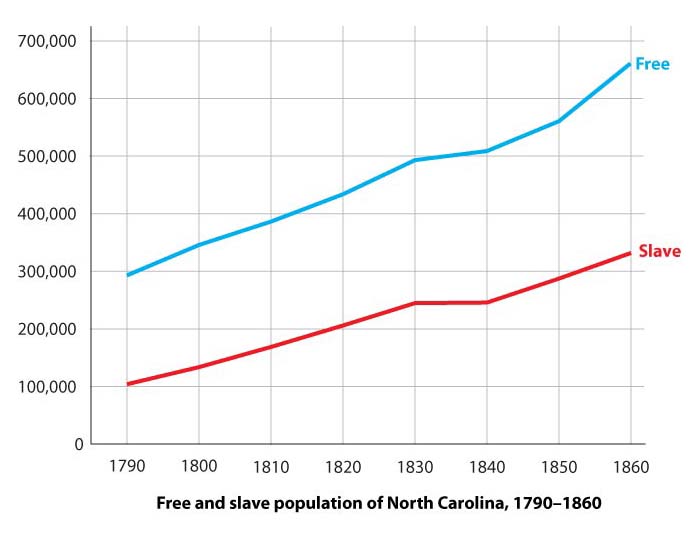
North Carolina
Let's look at the total number of people living in North Carolina between 1790 and 1860.
Questions
- When was population growth slowest in North Carolina?
- When was it fastest?
- Did free and enslaved population grow at the same rate, or were there differences? Why might this be?
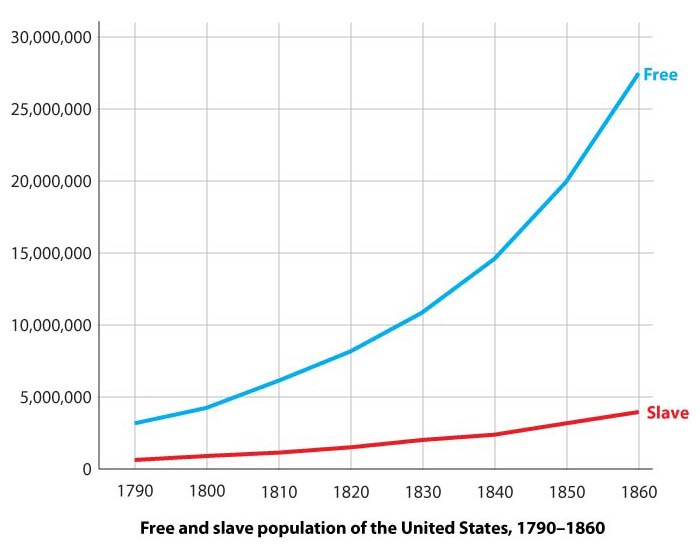
The United States
Now let's compare North Carolina's population growth to the growth of population in the entire United States.
Questions
- When was population growth fastest across the U.S.?
- How did population growth nationwide compare to the growth of population in North Carolina? Was it faster, slower, about the same? When was there the biggest difference?
- Did free and enslaved population grow at the same rate, or were there differences? Why might this be?
Graphs vs. raw data
Graphs can give us a quick visual sense of the data, but they can also be misleading. Here, we've presented two graphs with different scales and asked you to compare them. The population of the United States was so much bigger than that of North Carolina that we couldn't easily present them on the same graph. As a result, the population numbers are much higher on the second graph even though the two graphs are the same physical size. Essentially, we've squashed a really tall graph to make it fit your web browser.
Why is that a problem? When you look at population growth, you're looking at the slope of the graph -- how fast it rises. If we stretch or shrink the graph, the slope will seem to change. In this case, even though it's clear that U.S. population was rising more quickly over time, in fact, it was rising even faster than the graph suggests.
The numbers don't change, though, so if you want to check the data, here's a table of population for North Carolina and the United States every ten years -- the data from which we drew the graphs.
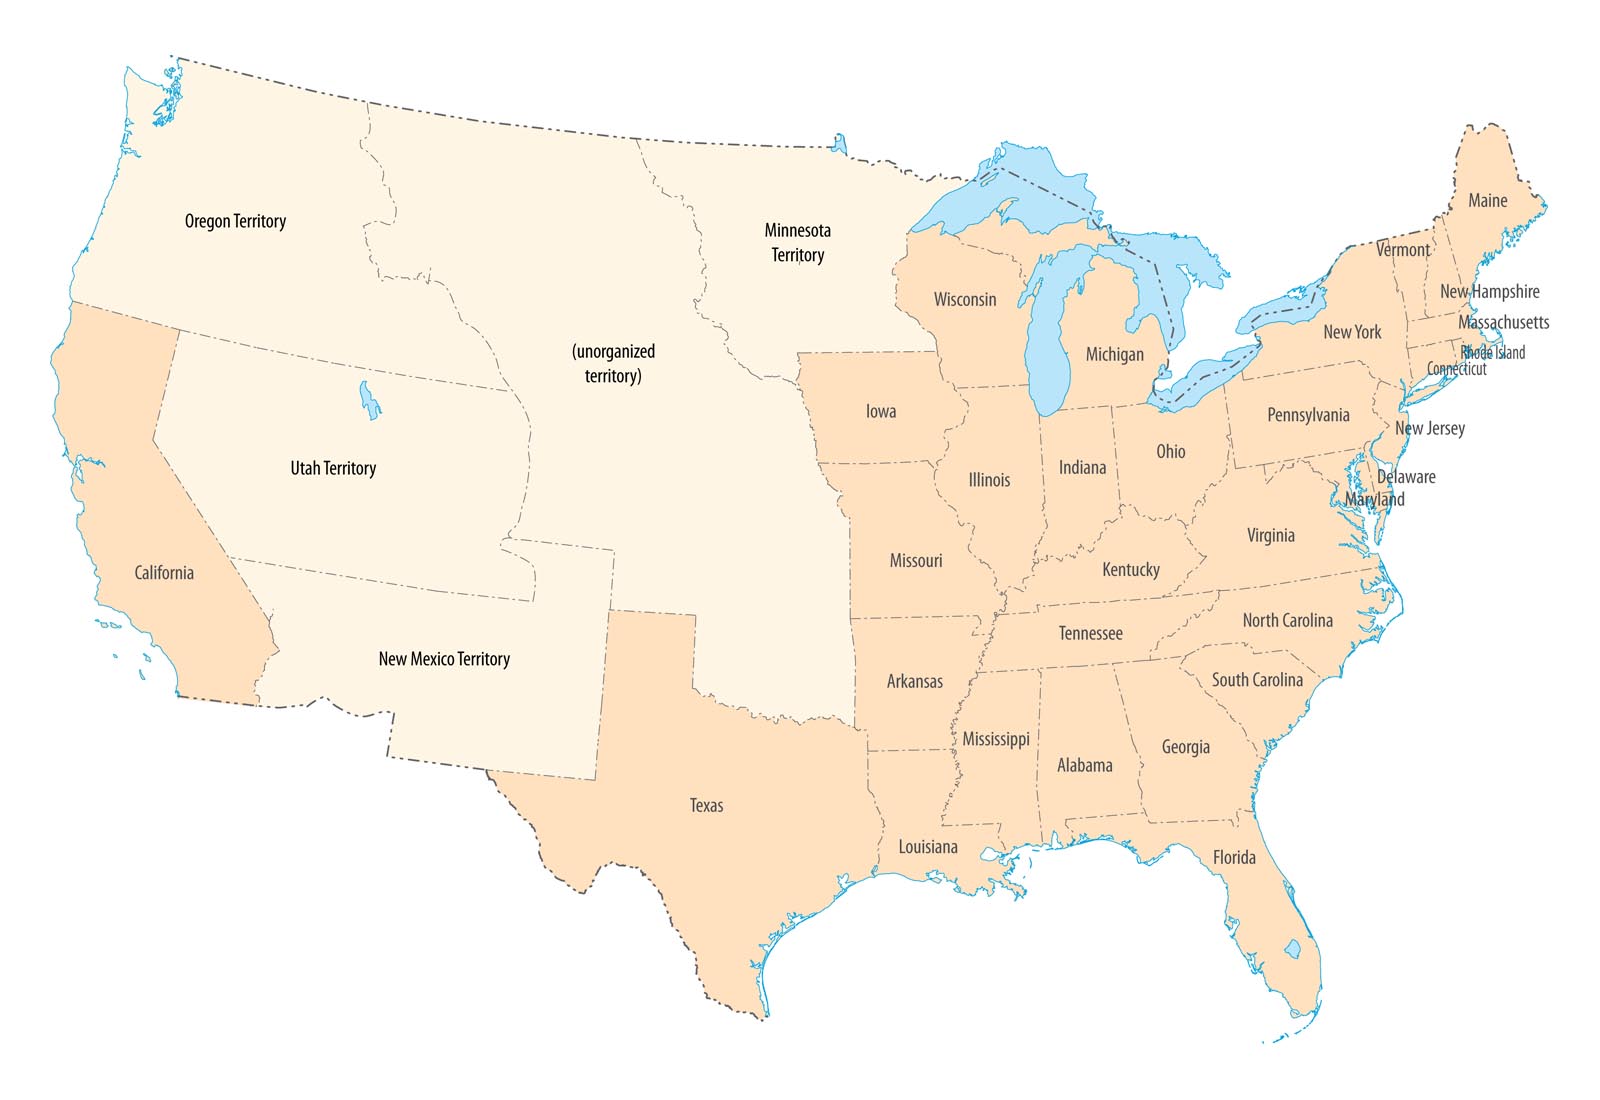
Out-migration
The first few censuses only counted total population, divided by demographic groups -- white and nonwhite, male and female, free and enslaved, and age ranges. By the middle of the nineteenth century, though, census officials began to ask other questions that can help historians today answer questions about that time. In 1850, for example, the census asked people which state they had been born in, and so we can learn how many residents of each state had been born in North Carolina. These numbers give us a sense of the scale of out-migration in the early 1800s. The map of the U.S. in 1850 will help you see where migration was heaviest.
Questions
- Which states and territories (other than North Carolina itself, of course) had the most residents born in North Carolina? Where were those states -- did they border North Carolina? Did North Carolinians tend to go north? south? west?
- Add up the numbers from each state and territory. What percentage of people born in North Carolina lived elsewhere by 1850?
Immigration
Finally, let's consider immigration into the United States. The 1850 census also tracked the number of foreign-born people living in each state and their country of birth, so we have good data on immigration in the mid-nineteenth century.
Questions
- Look at the bottom rows of the table first, labeled "total population" and "total foreign." What percentage of the population of the United States was foreign-born? What percentage of North Carolina's popuation was foreign-born?
- From what countries was immigration into the U.S. heaviest?
- From what countries was immigration into North Carolina heaviest?
- Why might there have been such a discrepancy in immigration rates between North Carolina and the nation as a whole? (You probably can't answer this question fully yet -- but keep it in mind as you continue reading about North Carolina before the Civil War.
Looking ahead: Push and pull factors
As you explore the documents in this chapter and those that follow, think about the factors that led people to leave North Carolina. Historians talk about two kinds of reasons for migration: push factors and pull factors. Push factors are reasons people might want to leave a place, while pull factors are things that attract them to a new home. What pushed people out of North Carolina in the first decades of the nineteenth century? What lured them to the West?