Although Hurricane Floyd was the biggest storm of 1999 and the one most remembered, eastern North Carolina was hit by three hurricanes in a six-week period in September and October that year. All brought large amounts of rain. Hurricane Dennis (September 4-5) saturated the ground. Floyd (September 14-16) created the worst of the flooding. Then, a month later, Hurricane Irene (October 17) brought rivers and streams back to the flood stage.
The maps and charts on this page will help you analyze where and when the rain fell and why the flooding was so bad.
Paths of the hurricanes
The image below is a satellite image of eastern North Carolina, with tracks for Hurricanes Dennis, Floyd, and Irene, September-October 1999. The red lines represent boundaries of river basins. If you look closely, you can see flooding along the Tar, Neuse, and Waccamaw rivers, as well as sediment plumes in Albemarle Sound and the Pamlico River.
A slow-moving storm
Hurricane Floyd was a very large storm -- much larger than most hurricanes, even many that were far more powerful. It also moved very slowly across eastern North Carolina, which is why rainfall totals were so high. The following animation shows satellite images of the storm for September 15 and 16; the numbers at the bottom show the date and time of each image.
Rainfall from Hurricanes Dennis and Floyd
The maps in the margins show rainfall in eastern North Carolina during the passage of hurricanes Dennis and Floyd, with the locations of selected rain gauges.
Rainfall amounts
The table below shows rainfall amounts from hurricanes Dennis, Floyd, and Irene at various locations in central and eastern North Carolina, with normal totals for the same period. The locations are divided by river basin (see below).
Rainfall from hurricanes Dennis, Floyd, and Irene, September-October 1999 .
|
Location |
Hurricane Dennis (Sept. 3-7) |
Hurricane Floyd (Sept. 14-17) |
Hurricane Irene (Oct. 17-18 |
Sept.-Oct. 1999 total |
Annual average rainfall |
|---|---|---|---|---|---|
|
Tar-Pamlico River Basin |
|||||
|
Oxford |
6.07 |
5.67 |
1.94 |
20.15 |
43 (est.) |
|
Louisburg |
5.59 |
8.88 |
2.01 |
24.34 |
45.56 |
|
Rocky Mount |
5.06-7.59 |
14.07-18.00 |
5.16 |
37.72 |
44.24 |
|
Enfield |
7.01 |
11.84 |
4.30 |
32.39 |
44.54 |
|
Greenville |
7.03 |
12.63 |
3.29 |
30.20 |
49.00 |
|
Washington |
7.60 |
10.73 |
5.07 |
31.05 |
46.96 |
|
Neuse River Basin |
|||||
|
Durham |
3.30 |
5.98 |
0.91 |
18.60 |
48.10 |
|
Raleigh |
8.46 |
6.55 |
1.50 |
24.24 |
41.43 |
|
Clayton |
5.35 |
9.80 |
2.59 |
20.98 |
45.11 |
|
Goldsboro |
7.19-7.94 |
12.06-12.70 |
4.36 |
32.10 |
49.27 |
|
Wilson |
7.60 |
10.73 |
5.07 |
31.05 |
46.96 |
|
Kinston |
6.07-6.93 |
13.35-13.98 |
5.37 |
29.48 |
51.20 |
|
New Bern |
4.00 |
5.51 |
6.39 |
19.82 |
53.11 |
|
Trenton |
7.42 |
14.98 |
— |
>24.60a |
52.22 |
|
Cape Fear River Basin |
|||||
|
Chapel Hill |
12.52 |
4.67 |
0.84 |
26.55 |
46.02 |
|
Dunn |
4.50 |
7.65 |
4.34 |
23.81 |
47.72 |
|
Fayetteville |
2.12 |
7.23 |
4.19 |
21.83 |
46.72 |
|
Clinton |
2.96 |
11.50 |
4.33 |
27.50 |
49(est.) |
|
Willard |
1.30 |
13.23 |
— |
>21.01a |
53.04 |
|
Elizabethtown |
>1.19b |
>14.19b |
>6.69b |
>28.00b |
46.78 |
|
Wilmington |
0.59 |
19.06 |
2.73 |
27.10 |
54.27 |
|
Waccamaw and Lumber River Basins |
|||||
|
Lumberton |
1.34 |
9.82 |
5.48 |
24.16 |
46.54 |
|
Whiteville |
1.52 |
16.76 |
5.97 |
34.27 |
48.73 |
|
Other sites |
|||||
|
Lewiston |
3.56 |
9.73 |
3.47 |
19.55 |
46.82 |
|
Williamston |
7.20 |
16.28 |
5.54 |
35.55 |
48.07 |
|
Edenton |
5.07 |
6.18 |
6.12 |
23.59 |
48.54 |
|
Elizabeth City |
7.68 |
2.64 |
5.06 |
17.73 |
48.48 |
|
Plymouth |
5.03 |
7.37 |
-- |
>15.15a |
51.06 |
|
Morehead City |
4.29 |
4.33 |
— |
>11.21a |
55.05 |
|
Hoffman Forest |
6.49 |
9.78 |
— |
>19.58a |
55.60 |
|
(a) October rainfall records are unavailable. |
|||||
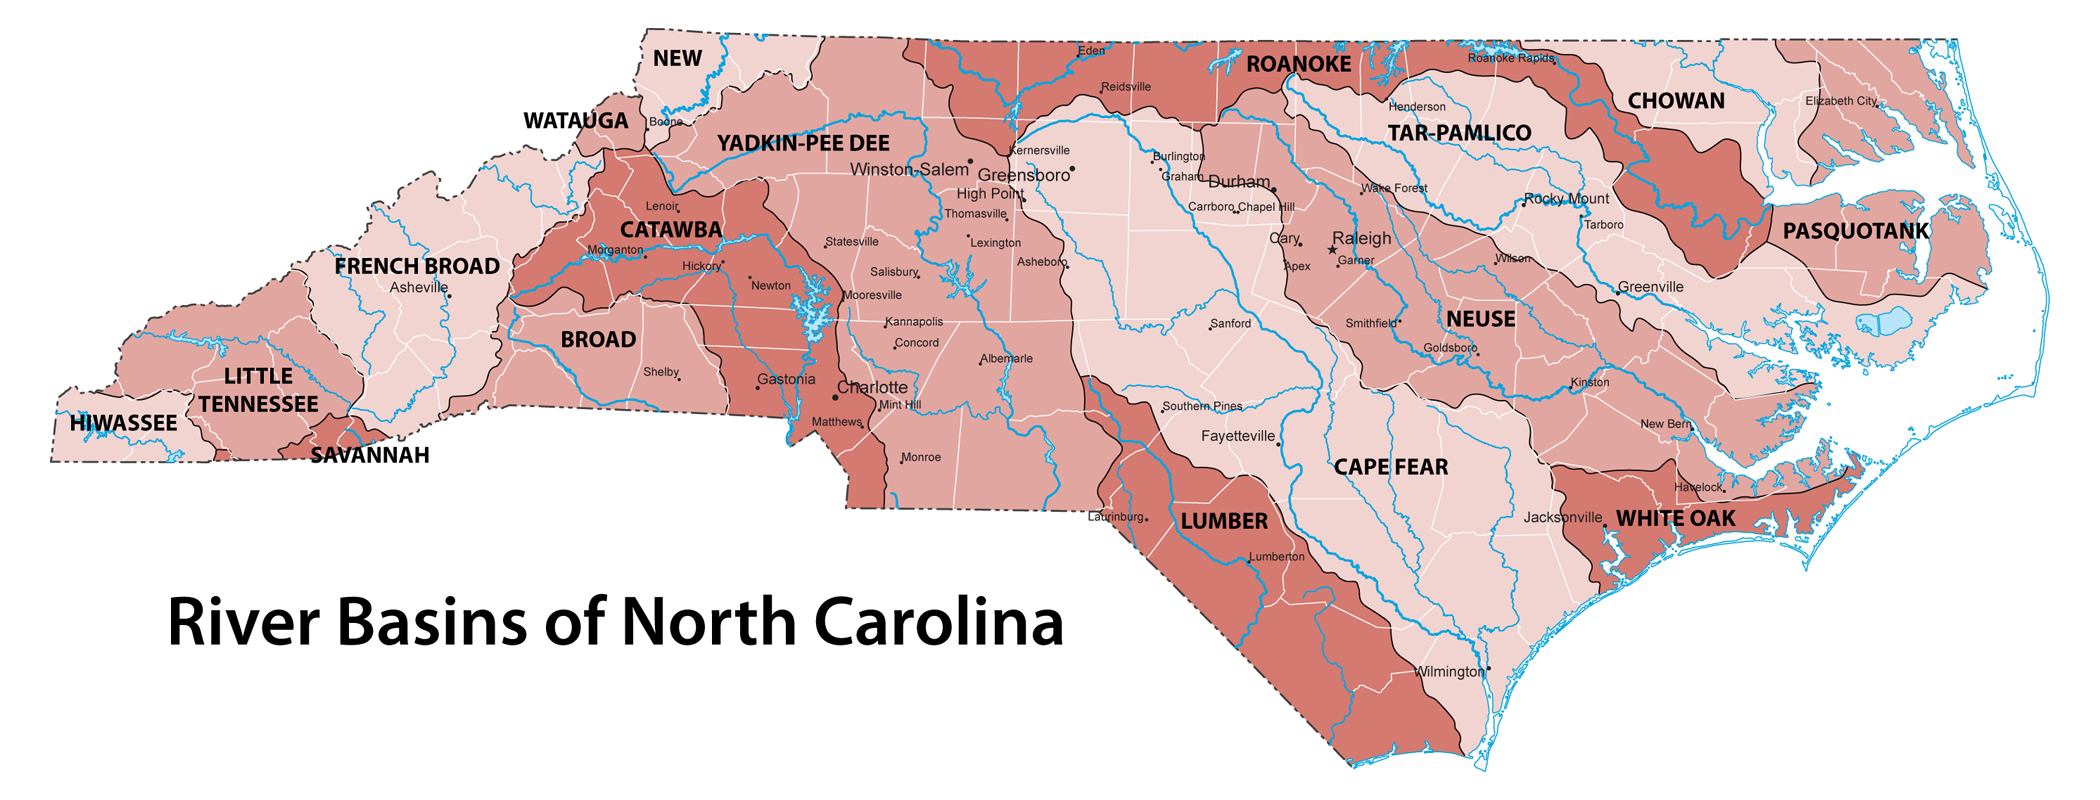
River basins
By comparing the maps and data of rainfall totals with this map of river basins, we can see why flooding occurred where it did. A river basin is all the land drained by a given river. All rain that falls in the Cape Fear River basin, for example, runs off into streams and smaller rivers that eventually join the Cape Fear before it ends in the Atlantic Ocean. If there is a great deal of rainfall in a river basin, that river is likely to flood downstream -- even if the locations downstream didn't get much rain.
Based on this map and the data and map above, which rivers would you predict were most likely to flood?
Flood levels
The data below, provided by the U.S. Geological Survey, shows how high the water was at various streamgaging stations (stations where stream or river information is measured) at the peak of flooding. The recurrence interval is how often the river was expected to be that high. Note that in some places, the waters overflowed the 500-year floodplain -- the region where flooding would reasonably be expected an average of once every 500 years! (See this discussion of floodplains.)
Compare these flood levels with your predictions above. Were you right?
Hurricane Floyd flood information for selected streamgaging stations in North Carolina and Virginia
|
Station name |
1999 floods |
||
|---|---|---|---|
|
Date |
Peak stage (ft) |
Recurrence interval (years) |
|
|
Chowan River Basin |
|||
|
Nottoway River near Sebrell, Va. |
9/20 |
27.01 |
50-100 |
|
Blackwater River near Franklin, Va. |
9/18 |
26.27 |
100-500 |
|
Meherrin River near Lawrenceville, Va. |
9/18 |
29.95 |
10-25 |
|
Potecasi Creek near Union |
9/16 |
28.9 |
>500 |
|
Ahoskie Creek at Ahoskie |
9/17 |
17.32 |
>500 |
|
Roanoke River Basin |
|||
|
Cashie River near Windsor |
9/16 |
18.52 |
>500 |
|
Tar-Pamlico River Basin |
|||
|
Tar River near Tar River |
9/16 |
17.59 |
10 |
|
Tar River at Louisburg |
9/17 |
26.05 |
50-100 |
|
Tar River below Tar River Reservoir |
9/17 |
32.89 |
100-500 |
|
Tar River at Rocky Mount |
9/17 |
31.66 |
100-500 |
|
Swift Creek at Hilliardston |
9/17 |
21.30 |
>500 |
|
Little Fishing Creek near White Oak |
9/16 |
30.8 |
>500 |
|
Fishing Creek near Enfield |
9/18 |
21.65 |
500 |
|
Tar River at Tarboro |
9/19 |
41.51 |
>500 |
|
Conetoe Creek near Bethel |
nd |
19.79 |
nd |
|
Tar River at Greenville |
9/21 |
29.72 |
nd |
|
Chicod Creek near Simpson |
9/18 |
21.46 |
nd |
|
Pamlico River at Washington |
9/16 |
8.14 |
nd |
|
Van Swamp near Hoke |
9/16 |
7.43 |
25 |
|
Neuse River Basin |
|||
|
Neuse River near Falls |
10/14 |
5.95 |
5-10 |
|
Crabtree Creek at U.S. 1 at Raleigh |
9/16 |
16.88 |
nd |
|
Neuse River near Clayton |
9/17 |
20.67 |
25-50 |
|
Neuse River at Smithfield |
9/18 |
26.72 |
>50 |
|
Swift Creek near McCullars Crossroads |
9/16 |
13.06 |
10 |
|
Middle Creek near Clayton |
9/16 |
13.02 |
10-25 |
|
Little River near Princeton |
9/17 |
16.58 |
>500 |
|
Neuse River near Goldsboro |
9/20 |
28.85 |
50 |
|
Neuse River at Kinston |
9/22 |
27.71 |
50-100 |
|
Contentnea Creek near Lucama |
9/16 |
25.0 |
100 |
|
Nahunta Swamp near Shine |
9/17 |
21.00 |
>500 |
|
Contentnea Creek at Hookerton |
9/18 |
28.28 |
>500 |
|
Neuse River near Fort Barnwell |
9/20 |
22.75 |
nd |
|
Trent River near Trenton |
9/17 |
22.33 |
>500 |
|
New River Basin |
|||
|
New River near Gum Branch |
9/16 |
25.12 |
>500 |
|
Cape Fear River Basin |
|||
|
Haw River near Bynum |
9/16 |
13.42 |
<2 |
|
Deep River at Moncure |
9/6 |
9.15 |
2-5 |
|
Cape Fear River at Lillington |
9/16 |
14.46 |
2 |
|
Flat Creek near Inverness |
9/16 |
3.84 |
2-5 |
|
Cape Fear River at Lock 3 |
9/17 |
21.59 |
10 |
|
Cape Fear River at Lock 1 |
9/20 |
23.30 |
5-10 |
|
Hood Creek near Leland |
9/16 |
13.89 |
100 |
|
Black River near Tomahawk |
9/18 |
27.14 |
100-500 |
|
Northeast Cape Fear River near Chinquapin |
9/18 |
23.51 |
>500 |
|
Lumber and Waccamaw River Basins |
|||
|
Waccamaw River at Freeland |
9/20 |
19.30 |
>500 |
|
Lumber River at Boardman |
9/19 |
10.70 |
25 |
Source: "Two Months of Flooding in Eastern North Carolina, September - October 1999: Hydrologic Water-Quality, and Geologic Effects of Hurricanes Dennis, Floyd, and Irene," by Jerad D. Bales, Carolyn J. Oblinger, and Asbury H. Sallenger, Jr. USGS report.
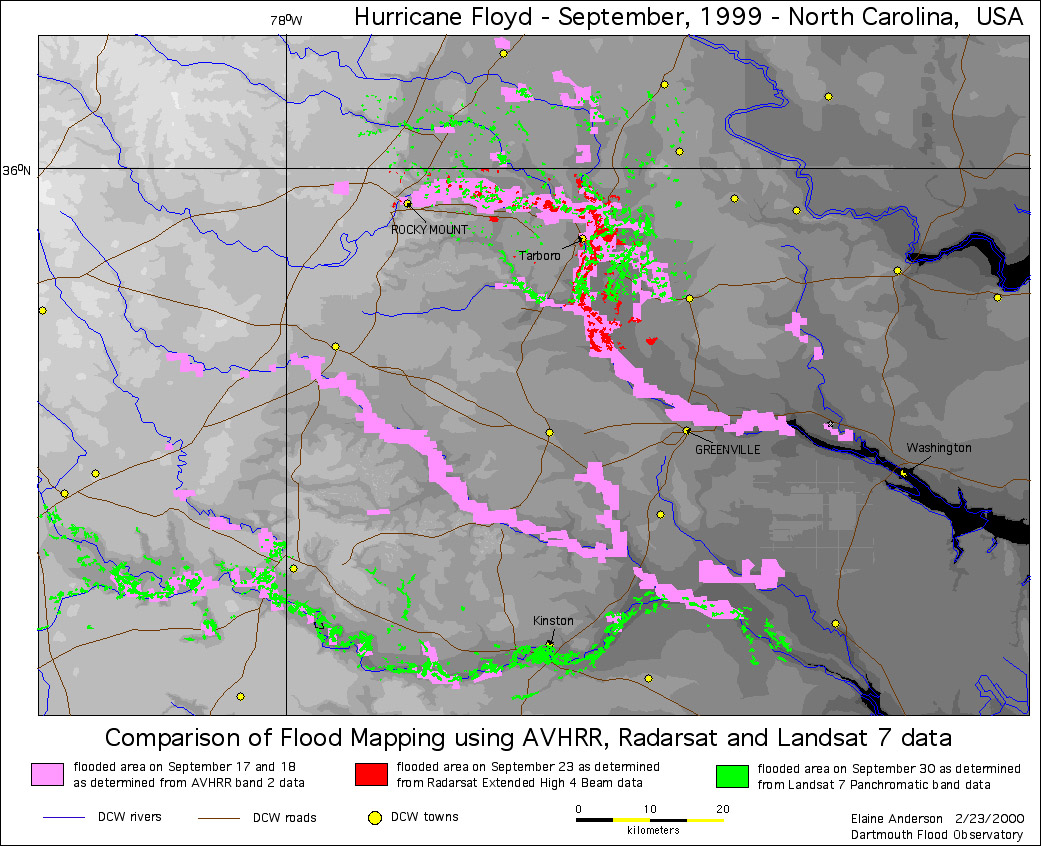
Mapping the flood
How far did the floodwaters spread? The flood map data combines satellite data from three different sources to give you a picture. How far floodwaters spread depends not only on how high the water is but on the local terrain. If the land near a flooded river is quite flat, the floodwaters may spread quite a distance.