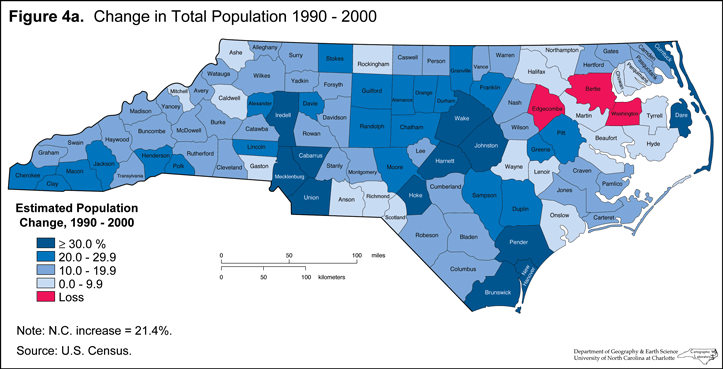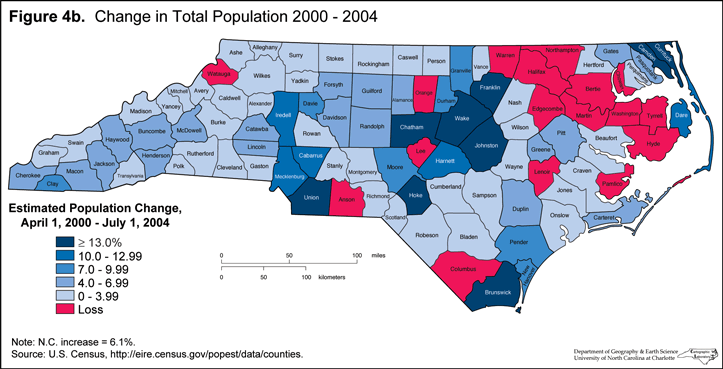

Figure 4b, suggests that a major trend may be developing in the state, a throwback to earlier decades. Between 1990 and 2000, as shown in Figure 4a, despite the strong shift in growth toward Piedmont metro areas, only three rural counties recorded actual population losses, all in the northeastern corner of the state. However, this changed dramatically during the 2000 to 2004 era, when no less than 16 counties showed a loss of people. Some of these losses are probably related to the decline in textile and apparel jobs in rural areas. Many of the losing counties are concentrated in the northeast, extending from some coastal areas inland onto the Inner Coastal Plain. Craven, Wayne and Onslow Counties host major military facilities and their slow growth is likely related to shifts of military personnel to other places, including deployments overseas. Otherwise, these northeastern counties are sparsely populated and have heavily agricultural economies that have been hurt by the drop in the domestic demand for tobacco, as well as the closing of textile and apparel factories. Most, however, don’t serve as recreational/retirement areas since they lack access to the beaches or are too remote to attract many retirees.

This pattern of population decline can be thought of as a throwback to earlier decades, such as the 1960s when many of the same counties lost people. Thus, it appears that, as noted in the Manufacturing section, strong efforts by the state to promote economic development in rural North Carolina have not succeeded in holding people in these areas. More decisive are shifts in the national economy that have undercut the economic bases of these rural areas while favoring larger urban areas.
The patterns displayed in Figure 4b are, of course, only estimates for a four-year period and it remains to be seen whether or not this striking pattern of rural loss and metro gains holds up over more time. If it does, it may signal an acceleration of growth in metro areas, accompanied by a dramatic emptying out of large parts of rural North Carolina.
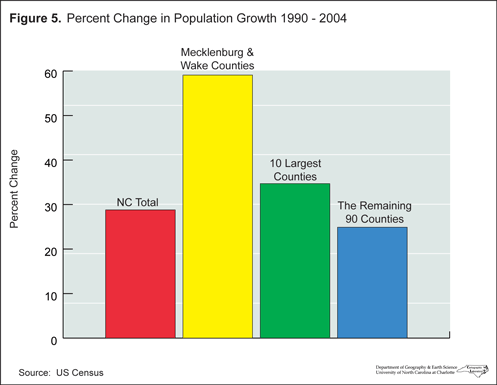
This shift is displayed in another way and over more time in Figure 5. It shows that the state’s two most populous counties, Mecklenburg and Wake, grew by 59.1% during the 1990-2004 span, more than twice the statewide growth rate. And they, along with the state’s eight other largest counties, grew by nearly 35%. In contrast, the remaining 90 counties gained by less than 25%. The 12 counties in that group that had populations of less than 15,000 in 2004 grew by 12% during the 14 year period, less than half the statewide rate.