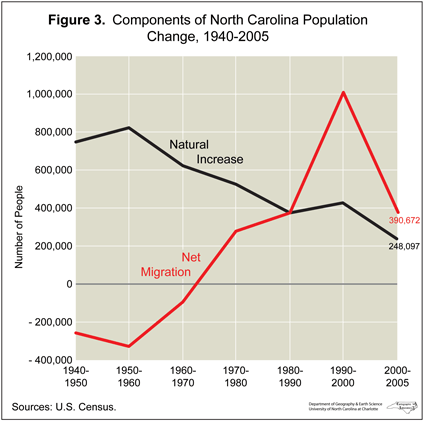
 Net migration and natural increase are the two ways in which the population of a place changes. The latter is the difference between the number of births and deaths that occur to residents. Figure 3 illustrates the inter-play between these two components that North Carolina has experienced since 1940. In the first several decades the state grew only because natural increase was large enough to offset losses due to out-migration. However, this began to change dramatically after 1960 when declining birth rates and improved health care caused the natural increase to decline and the state began to experience in-migration. In fact, in-migration accounted for 71 percent of the state’s growth between 1990 and 2000. In the 2000 to 2005 period its share of the net increase fell to just under 61 percent, perhaps reflecting the economic slowdown in 2001-2002 since the state’s robust economy appears to have been the primary attraction for most of the in-migrants.
A significant aspect of the in-migrants during the 2000-2005 period is that 48 percent were from international destinations, the rest coming from other parts of the US. In contrast, 24 other states, primarily in the Northeast and Mid-West, experienced net domestic out-migration during the 2000-2003 period.