Manufacturing has long been the backbone of the North Carolina economy. In 1975, for example, it accounted for over 36 percent of all non-farm jobs in the state. Nationally, by a variety of measures, the state ranks eighth largest in the nation in manufacturing even though its only the eleventh most populous. And it ranks even higher in terms of the proportion of the total population that has a factory job.
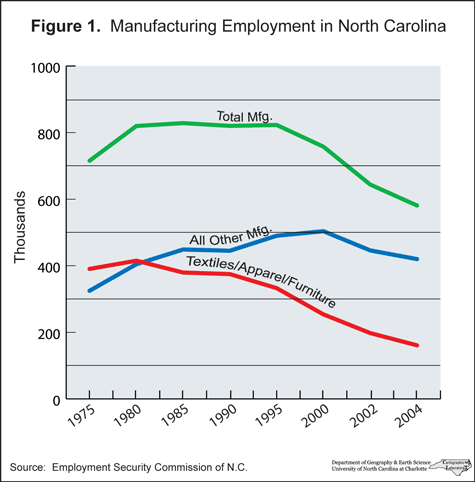
The absolute totals for factory employment continued to rise, with some fluctuations, after 1975 before peaking in 1995. Since then they have declined steadily (Figure 1). In terms of its relation to the total economy, the decline has been even sharper. The 1975 share was halved by 2004, to just 15.4 percent of the total. The state tends to have a greater proportion in factory jobs than does the US generally. In 1997 North Carolina’s share was 22.1 percent, compared with the national proportion of 15.4 percent.
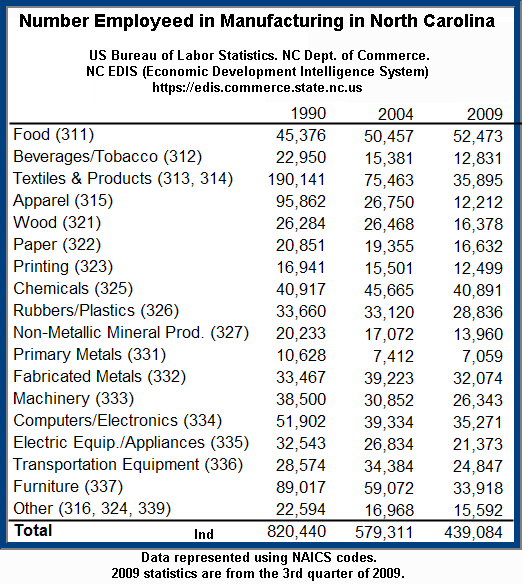
Industrial employment data from the Employment Security Commission of NC for the 1990-2004 period illustrate both recent declines in manufacturing but also the considerable diversification that has taken place in this sector of the economy. For example, the textiles, apparel and furniture industries lost a combined total of over 214,000 jobs during the period while all other manufacturing industries loss just 27,000 jobs. Increases were led by the chemicals, plastics/rubber, fabricated metals, and transportation equipment industries, which together added over 16,000 jobs. For the most part, these industries paid average annual wages that were close to or in excess of the $37,443 average annual wage paid to all manufacturing employees in 2004. The state’s highest wage industry, computers and electronics products, the fourth largest industrial employer, recorded a 24 percent employment drop, but that rate was less than that for all industries.

Diversification has had a substantial geographic component to it. For example, 1n 2002, 63 per cent of all jobs in chemicals were in the Raleigh-Durham, Charlotte-Gastonia and Greensboro/Winston-Salem/High Point MSAs and 79 percent of jobs in the computer and related electronics industry were found in these same three MSAs, led by Raleigh-Durham. Reflecting this, a national publication, Business Facilities: The Location Advisor, ranked Raleigh-Durham fourth and Charlotte 11th highest among U.S. high-tech cities in 2003.
These changes, both national and for North Carolina, reflect both sharp cyclical and secular downturns in manufacturing activity during the recent economic slump. The cyclical decline is shown by the fact that national factory jobs declined only 0.6 percent from 1999 to 2000 but recorded a sharp 10 percent decline from 2000 to 2001, with a loss of over two million factory jobs in that one year alone. However, the North Carolina slide goes back further, to the 1995 peak, reflecting the diversification noted above, a secular change. Total manufacturing employment has declined steadily since then and by 2004 the state’s loss totaled over 240,000 factory jobs, a drop of nearly 30 percent since 1990 (Figure 1). Thus, while the national losses reflect a short-term, cyclical loss that will rebound as the economy improves, a major part of North Carolina’s losses are longer-term and probably irreversible.
