Transportation topics: Introduction | Highway use | Public transportation | Highway conditions | Water transportation | Air and rail travel | Projected future innovations
North Carolina State Ports
North Carolina has two deep water ports that handle ocean-going vessels. Both are owned and operated by the North Carolina State Ports Authority. The Port of Wilmington offers facilities to handle containerized, bulk, and break-bulk cargoes. That port currently is dredged to a 42-foot channel depth, which allows additional vessel capacity. The port has direct access to Interstates 95 and 40, and daily train service from CSX Transportation.
The 45-foot channel at the Port of Morehead City makes it one of the deepest ports on the U.S. east coast. This port is located four miles from the ocean bar, and handles break-bulk and bulk cargo with access to Interstates 95 and 40via U.S. Highways 70 and 17 and daily train service from Norfolk Southern. Across the Newport River is state-owned Radio Island, a prime site for development. Trends in tonnage shipped from Morehead City and Wilmington Ports are shown in Tables 7 and 8.
|
Table 7. Tonnage Trend at Morehead City Port
|
|||
|
Year
|
Break-bulk
|
Bulk
|
Total
|
|
2001
|
240,203
|
2,516,973
|
2,757,176
|
|
2002
|
213,583
|
1,294,005
|
1,507,588
|
|
2003
|
243,574
|
1,296,618
|
1,540,692
|
|
2004
|
214,948
|
2,000,643
|
2,215,591
|
|
2005
|
315,440
|
2,115,309
|
2,430,749
|
|
2006
|
375,998
|
1,922,386
|
2,298,384
|
|
2007
|
276,128
|
1,862,213
|
2,138,441
|
|
2008
|
231,072
|
1,652,863
|
1,883,935
|
|
2009
|
167,454
|
1,725,432
|
1,892,886
|
|
2010
|
198,965
|
1,569,747
|
1,768,712
|
Source: North Carolina State Ports Authority.
|
Table 8. Tonnage Trend at the Wilmington Port
|
||||
|
Year
|
Break-bulk
|
Container
|
Bulk
|
Total
|
|
2001
|
844,052
|
600,014
|
768,376
|
2,212,442
|
|
2002
|
1,001,728
|
628,800
|
490,929
|
2,121,457
|
|
2003
|
976,082
|
613,923
|
630,799
|
2,220,804
|
|
2004
|
1,054,214
|
624,170
|
648,381
|
2,326,765
|
|
2005
|
1,271,417
|
781,046
|
951,601
|
3,004,064
|
|
2006
|
1,235,331
|
955,370
|
1,270,589
|
3,461,290
|
|
2007
|
897,776
|
1,174,335
|
1,368,550
|
3,440,661
|
|
2008
|
701,993
|
1,404,401
|
1,361,815
|
3,468,209
|
|
2009
|
413,446
|
1,338,436
|
1,322,963
|
3,074,844
|
|
2010
|
207,335
|
1,917,237
|
1,304,755
|
3,429,237
|
Source: North Carolina State Ports Authority.
Over the past ten years, a yearly average of approximately 513 ships and barges have called on the Port of Morehead City and approximately 406 ships and barges have called on the Port of Wilmington. More than 70 percent of marine traffic at Morehead City has been barge traffic, with destinations being north or south on the Intercoastal Waterway. Approximately 90 percent of marine traffic at Wilmington has been ocean-going ships. Currently, approximately 250,000 TEUs (Twenty-foot Equivalent Units - Containers) are moved at the Port of Wilmington annually.
North Carolina Ferry System

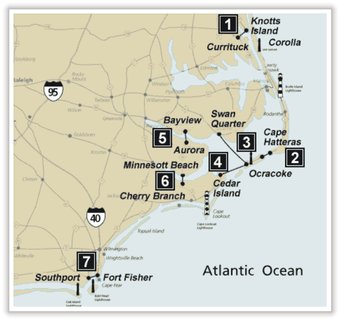
North Carolina has the second largest state-owned ferry system in the nation, with 21 vessels carrying 2.5 million passengers and 1.1 million vehicles annually on seven currently operating routes. These routes are shown in Figure 21. Route number 2 from Currituck to Corolla is not yet in service in mid-2005 due to the lack of docking facilities. Crossing times for each operating route are shown in Table 9. In addition to these public ferries that operate in the North Carolina Sounds, recreational boating is very popular in the Old North State. In addition to these publicly owned vessels operated by the State Ferry Division, there are an additional 16 private ferry companies operating in the inner sound areas that are regulated by the North Carolina Utilities Division. Most of these ferries are for passenger travel only.
|
Table 9. Duration of Crossings and Number of Ferries per Day
|
||
|
Ferry
|
Crossing Time
|
No. of Crossings/Day (Peak Season)
|
|
1. Currituck-Knotts Island
|
45 minutes
|
12
|
|
2. Hatteras-Ocracoke
|
40 minutes
|
63
|
|
3. Ocracoke-Swan Quarter
|
2.5 hours
|
8
|
|
4. Ocracoke-Cedar Island
|
2.25 hours
|
12
|
|
5. Bayview-Aurora
|
30 minutes
|
22
|
|
6. Cherry Branch-Minnesott Beach
|
20 minutes
|
56
|
|
7. Southport-Fort Fisher
|
35 minutes
|
28
|
|
Source: The Institute for Transportation Research and Education at North Carolina State University, Benchmarking and Optimization of the North Carolina Ferry System 2009, 2010. |
||

Boating is not the only mode of travel related to recreation and tourism, of course. Integrated into the fabric of the state’s various modes are travel destinations and associated economic impacts attributable to travel and tourism. Tourism is an increasingly important part of the state’s economy, ranking in the top ten sectors of the economy in overall economic impact. Another chapter in the NCpedia addresses Travel and Tourism in some detail, so this chapter on Transportation only mentions briefly some statistics concerning transportation, travel, and tourism. Personal vehicle travel accounts for 86 percent of recreational and tourist travel in North Carolina. Air travel accounts for ten percent, including leisure, recreation, touring, etc. A surprising number of visitors to coastal areas travel through on the Intercoastal Waterway, which runs the length of the coastal area from Southport in the south to the Virginia border in Currituck Sound, just north of the village of Currituck. A significant number of visitors arrive by tour buses, both from originations inside the state and from outside. In 2009, over $15.6 billion dollars were spent statewide on tourism.