Transportation topics: Introduction | Highway use | Public transportation | Highway conditions | Water transportation | Air and rail travel | Projected future innovations
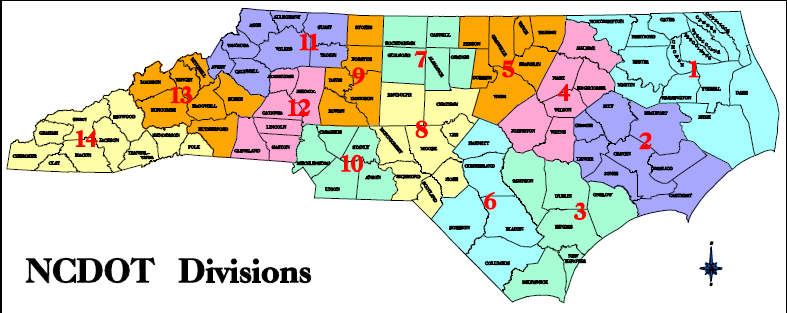
Figure 14 outlines NCDOT's fourteen highway divisions. Several of the illustrations that follow Figure 14 are based on data summaries for these 14 field divisions of the North Carolina Division of Highways. The following figures illustrate a summary of North Carolina’s highway funding over the past decade, plus trends in traffic safety, and bridge and highway maintenance conditions.
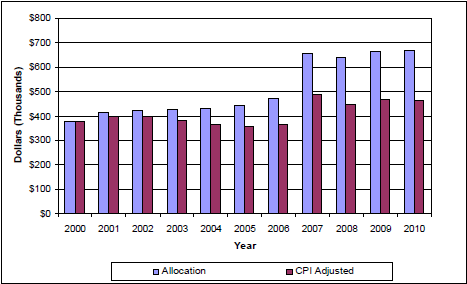
According to NCDOT’s Maintenance Condition Assessment Report: December 1, 2010, much of the growth of the state’s highway system is in the form of widening two-lane highways to four-lane facilities and constructing urban loops. These types of roadways are costly to maintain and preserve. When past maintenance funding is adjusted by the Consumer Price Index, the total dollar amount devoted to maintenance operations is 22 percent higher in 2010 than in 2000, as indicated in Figure 15.
For the past two decades, the field divisions of the North Carolina Division of Highways have conducted biennial surveys of the structural condition of pavements and periodic surveys of bridges. The NCDOT analyzes these data and develops pavement and bridge condition indices as condition measures in order to prioritize scarce maintenance and repair funds for pavement and bridge repairs.
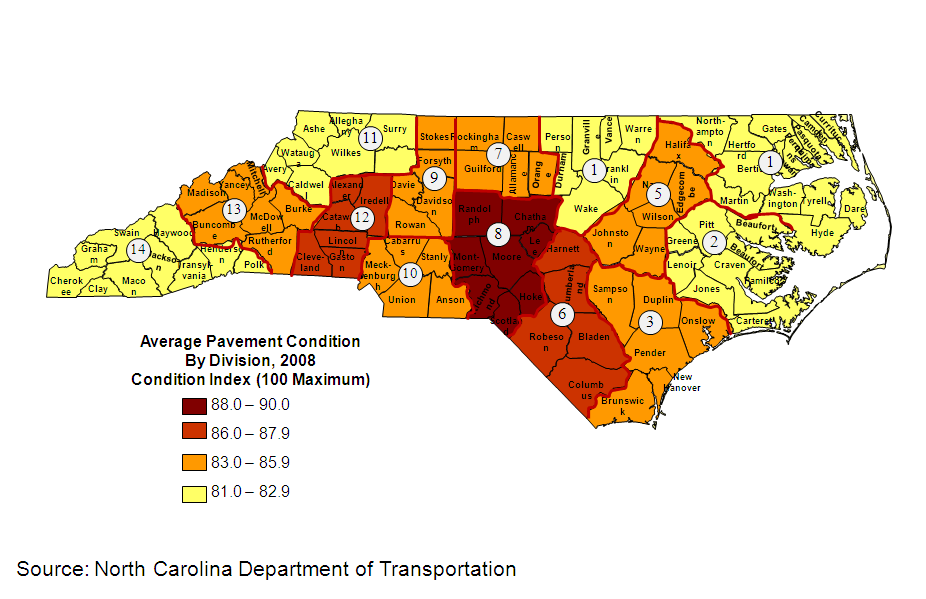
An index of pavement conditions is based on a 100-point scale (Figure 16. Points are deducted for each segment of highway with structural failures or various types of cracking resulting from heavy traffic, environmental conditions such as freezing and thawing, flooding, substructure failure, inadequate pavement design, and other conditions. Conditions that existed on the highways in each Division are shown as “snapshots” of the indices in 2008. It should be noted that due to environmental conditions alone, highway engineers expect pavement condition to be worse in the mountainous areas due to more extreme winter temperatures and the freezing and thawing cycle that dramatically affects asphalt pavements.
The indices shown in these two tables include both Asphaltic Concrete (i.e., “asphalt”) and Portland Cement Concrete pavements. As expected, pavement conditions in general are in a greater need of repair in both years in the western divisions, although in 2008 two of the coastal plain divisions showed condition indices that on average were similar to the west. Such patterns are not unusual and various factors such as funding shortfalls may affect some areas, traffic may become heavier and more large trucks impact the pavement condition, etc.
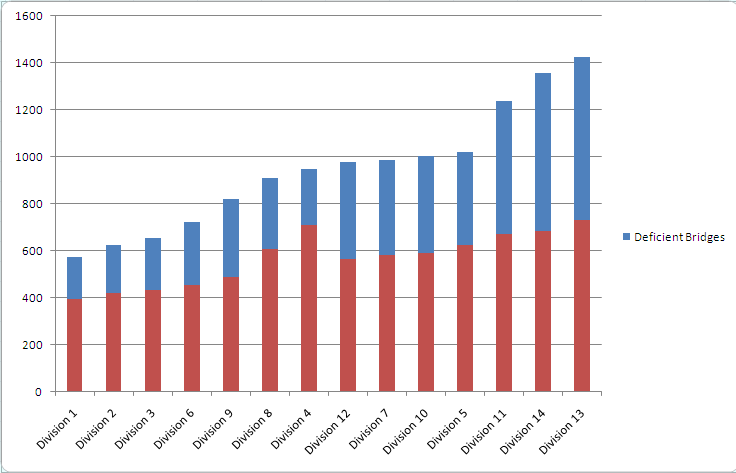
Bridges on the state highway system are also evaluated regularly with a set of factors that rate the bridge substructure, deck, railings and parapets, trusses, and bridge pilings. Bridges are graded on adequacy of structure and function. Structurally deficient bridges are those that are given the highest priority for replacement or repair. Bridges that are functionally obsolete are generally older structures that could soon be structurally deficient. The difference between the bridge condition and pavement condition ratings is that pavement conditions subtract from a “perfect” 100 score, but bridge condition indices are evaluated with units that start at zero and are added as positive factors. While there are bridges in North Carolina that are considered “deficient” (see Figure 17), these bridges are not considered unsafe. Every bridge in North Carolina is inspected at least every two years, in accordance with the National Federal Standard for Bridge Inspection.
Highway Traffic Safety
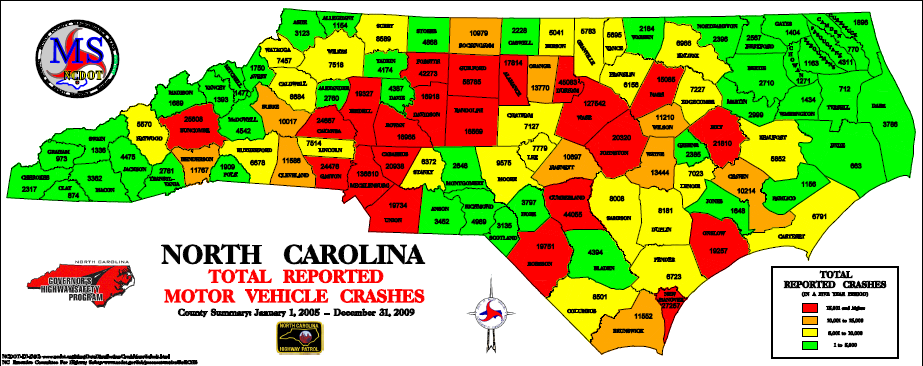
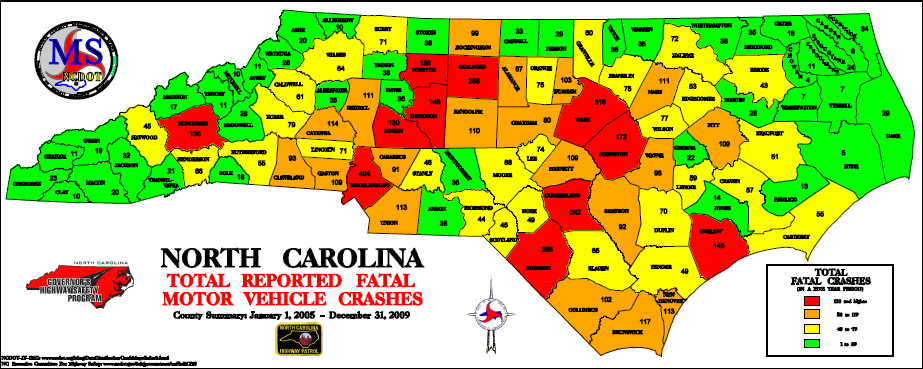
Figures 18 and 19 are again (like the data on pavement and bridge conditions) not reflecting trends but illustrate data on highway crashes during a group of years over the past decade.
To illustrate the trends on a year-to-year basis, Table 6 presents important indicators of crashes on streets and highways. These data include all types of accidents, including motorcycle, bicycle and pedestrian fatalities, injuries, and crashes. While the total number of crashes illustrates a slight upward trend (primarily due to increased travel), the number of injuries and fatalities has declined over this eleven-year period. Between 2000 and 2010, crash rates and fatality rates also decreased statewide.
Table 6. North Carolina Highway Crash Data, 2000 – 2010
|
Year
|
Crashes
|
Fatalities
|
Injuries
|
VMT
(100MVMT)1
|
Crash Rate
|
Fatality Rate
|
Injury Rate
|
|
2000
|
231647
|
1561
|
141169
|
892.46
|
259.56
|
1.75
|
158.18
|
|
2001
|
225607
|
1533
|
134074
|
915.71
|
246.37
|
1.67
|
146.42
|
|
2002
|
234478
|
1577
|
133317
|
936.86
|
250.28
|
1.68
|
142.3
|
|
2003
|
248564
|
1561
|
134533
|
937.63
|
265.1
|
1.66
|
143.48
|
|
2004
|
249155
|
1578
|
133035
|
956.27
|
260.55
|
1.65
|
139.12
|
|
2005
|
234816
|
1550
|
123935
|
1008.61
|
232.81
|
1.54
|
122.88
|
|
2006
|
236326
|
1555
|
120143
|
1016.48
|
232.49
|
1.53
|
118.2
|
|
2007
|
242174
|
1706
|
119714
|
1035.98
|
233.76
|
1.65
|
115.56
|
|
2008
|
235188
|
1464
|
112484
|
1014.63
|
231.8
|
1.44
|
110.86
|
|
2009
|
230965
|
1345
|
109529
|
1025.9
|
225.13
|
1.31
|
106.76
|
|
2010
|
237004
|
1327
|
108761
|
1032.26
|
229.6
|
1.29
|
105.36
|
|
Source: North Carolina Department of Transportation.
|
|||||||
Bicycle and Pedestrian Transportation
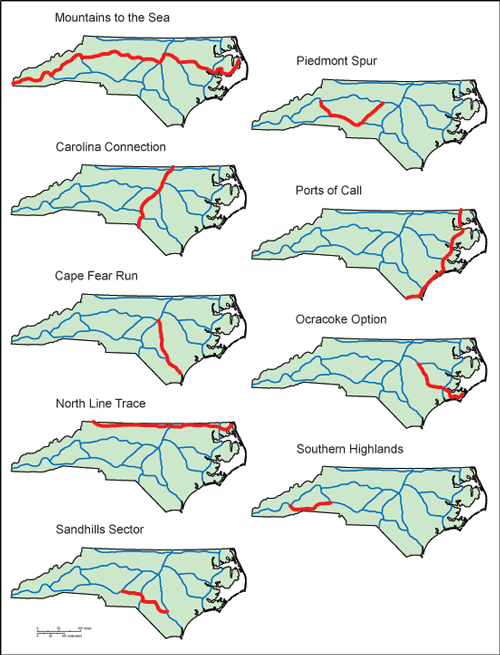
North Carolina has over three thousand miles of designated and signed bicycle routes with nine different primary bike routes across the state (Figure 20). These routes generally parallel major highways. Most routes are on state-maintained secondary roads.
The state of North Carolina developed Bicycling and Walking in North Carolina: A Long-Range Transportation Plan in 1996 that included a vision statement that all residents of North Carolina and visitors to the state should be able to walk and cycle safely and conveniently. The goals in this plan are:
1. Provide bicycle and pedestrian facilities necessary to support the mobility needs and economic vitality of communities throughout the state.
2. Provide a comprehensive program of education and enforcement strategies that will improve the safety of all bicyclists and pedestrians.
3. Institutionalize bicycle and walking considerations to enhance current transportation practices at the state, regional, county, and local level.
4. Identify and promote new and innovative ways to advance bicycle and pedestrian safety and enjoyment through research and needs assessment.
5. Encourage bicycling and walking as viable transportation options.