Related entry: 18th century hurricanes

Hurricanes have always been a major, highly visible, component of the weather and climate of North Carolina, but their number has differed dramatically from decade to decade. Table 5 includes all hurricanes and hurricane remnants that appear to have had an impact somewhere in the state. (The category is expressed as the Simpson-Saffir scale, which is shown below in References and Additional Resources). The actual numbers, especially early in the 20th century, include some estimates. Before satellite tracking arrived in the 1960s, for example, it was not clear whether a period of coastal erosion or flooding was the result of an unseen and unreported hurricane offshore or of a frontal system passing off the coast. The general results, however, are likely to be reliable. A rather small number of storms influenced the state in the 1911-1930 period, and they were not very intense. Then there was a slow increase, culminating in the 1950s with a whole series of storms, Hazel being especially notable as the only storm of the century to be a category 4 storm while over the state. Then came another quiet period from 1961 until 1980. In fact the present active period did not really get going until the late 1980s, most notably with Hugo in 1989.
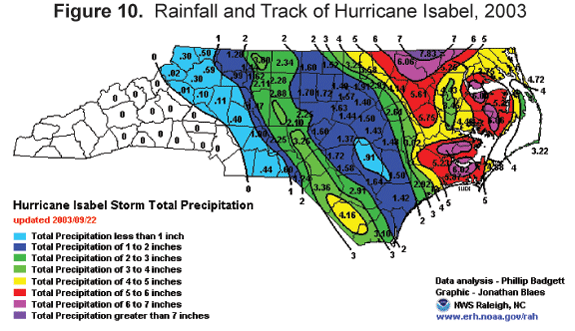
None of the hurricanes in the active period from Hugo onwards have been unprecedented in their size, or in the amount of wind and rain they bring. Many have given around 10 inches of rain in some small areas, and up to 6 inches over a much broader region. The locations affected, and the type of impact, depend strongly on the track of the eye of the storm. Hurricane Isabel is a typical example (Figure 10). The storm came ashore near Cape Lookout in the early afternoon of September 18, 2003. It arrived as a category 2 storm, but decreased to a category 1 over land as the eye tracked north-northwest. The storm left the state over Northampton County before 8:00 p.m. that evening. Much of the Piedmont received somewhat less than 4 inches of rain from the storm, the Coastal Plain getting between 4 inches and 7 inches. Some wind-related damage and river-based flooding ensued, but greater problems arose from the interaction of wind and water. As with most hurricanes, the strongest winds were to the east of the eye, being above 90 mph from the southeast over most of the Tidewater region, compared to less than 70 mph from a northerly direction over the Piedmont. The strong winds over the Tidewater pushed the waters of the sounds northwards, causing severe flooding on the north shores.

Isabel is but the latest - as of this writing - in the series of similar hurricanes of the last decade or so (as indicated in Figure 2.19 in The North Carolina Atlas). Slightly different tracks or configurations give different, sometimes very different, impacts. Bonnie, at the end of August 1998, was another storm arriving as a category 2 hurricane. This storm crossed Cape Fear and gave 12 inches of rain on the southeast coast, 6 inches over much of the Coastal Plain. Actual damage away from the coastline was rather light. More recently, tropical storm Allison, on June 15-16, 2001, gave between 3 and 6 inches of rain throughout the Coastal Plain, with a maximum in the northeast of over 10 inches. There was some flooded rivers and swamps in the area of maximum rainfall, but little impact elsewhere. Much more significant was the one-two punch of Dennis (August 28-September 8) and Floyd (September 7 - 19) in 1999. Dennis, slow-moving and wavering off-shore before a direct pass across the state from Cape Lookout to the northwest Piedmont (Figure 2), gave 15 inches of rain on the Outer Banks, decreasing to 6 inches in the northern Piedmont. Floyd's track from the Brunswick beaches to the Virginia border at Currituck produced 15 inches over the inner Coastal Plain, slightly less to the right of its track. Coming so close together, they gave a tremendous total rainfall. The consequences were the major and devastating floods over most of the Coastal Plain. But the situation was not unique, since sequences of two or even three hurricanes in quick succession, often giving much flooding, have commonly occurred in the past. But the long quiescent period of the second half of the 20th century seems to have put them into the distant past, while the development of the state during this quiet period has intensified the likely impact of these hurricanes when they do occur.
