GNU General Public License
You may share exact copies of this work as long as you credit the original author and provide a link to the license. Changing the item is not allowed under this license.
NCpedia and chat reference will be unavailable from 4:00 pm to approximately 4:30 pm on Friday, October 17th for maintenance. We apologize for the inconvenience.
 1136091600
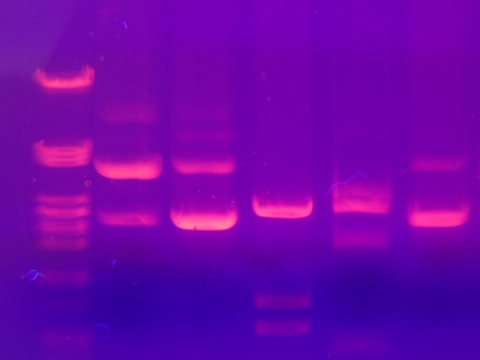
Gel electrophoresis showing six DNA tracks. In the first row (left), DNA with known fragment sizes was used as a reference. Different bands indicate different fragment sizes (the smaller, the faster it travels, the lower it is in the image); different intensities indicate different concentrations (the brighter, the more DNA). DNA was made visible using ethidium bromide and ultraviolet light.
GNU General Public License
LinkYou may share exact copies of this work as long as you credit the original author and provide a link to the license. Changing the item is not allowed under this license.