The climate trend of most concern for much of the world involves temperature change. Global warming is still in the headlines, or making even more headlines. Many groups are now concerned that the climate will soon reach a tipping point beyond which we shall not be able to recover until well into the distant future, if ever. Amid all of this, is there a warming in North Carolina? And if so, is it caused by the worldwide greenhouse effect, or by some local weather features? The answer for North Carolina is extremely difficult to determine. Partly, of course, this is because if one asks any scientist a simple question, everyone knows they will not get a simple answer. Nowhere is that more true than when one asks “Is the climate getting warmer?” Virtually all scientists would agree that the surface temperature of the planet has a whole has increased over the last few decades. But that’s about as far as any simple answer can go. Sentences beginning with “It depends what you mean…” begin arriving. Is there a reasonable answer for North Carolina?
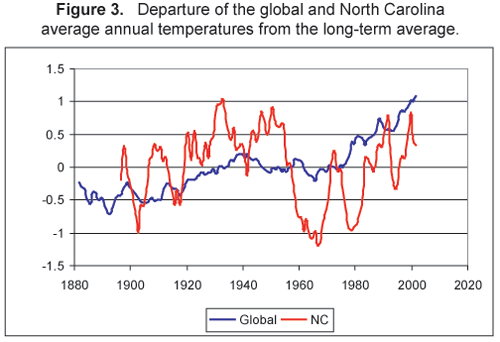
Even at the very simplest level, the question “are we getting warmer?” is not easy to answer. The whole world has certainly been getting warmer during the last 100 years, but North Carolina has been a major exception. The statewide annual average temperature between 1901 and 2000 has stayed more or less the same (Figure 3). North Carolina is not the only exception. Much of the southeastern United States has had similar temperatures. But the only other area of the world with the same lack of trend is southeast China, an area that is similar in almost all aspects of its climate. Indeed, understanding why these two areas provide a major exception to the general global pattern may hold the key to explaining exactly what is causing global warming.
Trends can best be shown by looking at the departure of temperature each year from the long-term mean value. Figure 3 shows this departure for the state and the planet, while Figure 1 shows the state’s actual temperatures. The state trend for the whole period between 1901 and 2000 was actually cooling at a rate of 0.17°F per century. Hardly significant, but certainly not global warming! But a closer look at Figure 3 shows how misleading a statement like this can be, and the difficulty of answering questions about warming. The trend for the second half of the century gave a warming at a rate equivalent to 0.71°F per century. During the last quarter of the century that rate increased to 4.4° F per century. All of these rates are “correct”, and seem to suggest that now the state is indeed getting warmer, and getting warmer ever faster. But the 1990s didn’t really get warmer at all. Clearly, temperatures can fluctuate on a yearly and decadal scale as easily as they change from day-to-day.
State temperature trends do reflect the global pattern, but show greater variability over time. This is almost always true of areas smaller than the globe, simply because the planet commonly has warm spots and cold spots every year which more or less cancel out the global picture. Globally there was warming during the early part of the 20th century, changing around 1940 to a slight cooling. This in turn was replaced by a warming, a rather rapid warming, in the 1970s. Our state has had a similar pattern, with the warming being at a similar rate to that of the globe, but the cooling, especially the big drop during the 1950s and 1960s meant that the state is not yet back to where it was in the 1930s & 40s.
The actual temperature variations over the state during the century are rather small. Going back to 1895 with statewide temperature estimates, the warmest year since then was 1990, with an annual temperature average of 61.48oF. The coldest was 1917, with 56.92oF. The actual value of the long-term average varies depending on the period one chooses to use, but it tends to hover around 59-60oF (Table 1).

The four most recent complete years have, on average, been warmer than the previous decade. However, there were periods in both the 1930s and the 1950s when the 4-year average was higher. So the state is certainly warm, but not yet at truly record setting levels.
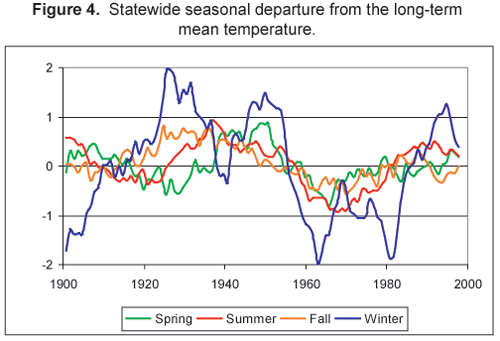
Each of the four seasons shows the same basic trend, although winter is clearly the one responsible for most of the long-term variability (Fig 4). Within the North Carolina climate regime this is to be expected. Every winter has alternating periods of cold clear weather and days with warmer, moister, cloudy conditions. A slight change in the frequency of each weather type can change the average temperature considerably. In contrast, summers every year tend to be continuously hot, although there are always some variations from day to day, leading to small changes in the average value. Although the winter swings are by far the largest, summer shows a similar trend and over the last few decades it has undergone a major warming.
This rather complex seasonal pattern gets more convoluted when one looks at the various regions of the state. Concentrating on the trends for the period 1971-2000 simplify this analysis. This is a time which seems to cover much of the latest warming trend and is the period which most people think of as giving the “normal weather” of the state. Indeed, it is the time period of the current “climatic normals”, the averages used when the media or the National Weather Service refer to the normal temperature for the day.
All trends for this period indicate warming, but rates differ between the regions and seasons (Table 2). In summer the Coastal Plain is warming the most rapidly, closely followed by the Piedmont. The Mountains are certainly warming, but not as rapidly. In winter it is the Mountains which are warming most, the Coastal Plain the least. Table 2 shows only the trends, emphasizing the regional differences. Further, although the rate of warming is expressed in degrees per century, it only shows the warming which has occurred over the last 30 years. It is not a forecast that Coastal Plain summers will be 5oF warmer 100 years hence. Attempting to show the actual year to year variations would produce a graph much more difficult to interpret than that, for example, Figure 4. Nevertheless, it is these trends, rather than the year-to-year variations, which are likely to be important when one considers the practical impacts of the temperature changes over the next few decades. For individuals the trends probably are not big enough to be noticed, and are certainly masked by the individual year-to-year variations. But they are big enough to have an impact on the vegetation and human activities. A rapid increase in winter warmth in the mountains, for example, is not good news for skiing, but the relatively slow summer temperature rises there may help the region’s reputation as a summer recreation area. The summer warming on the Coastal Plain may encourage more evaporation, adding to water supply problems there, while the higher winter temperatures may decrease the number of cold snaps which reduce pest populations or are needed for the optimal development of fruits such as peaches.

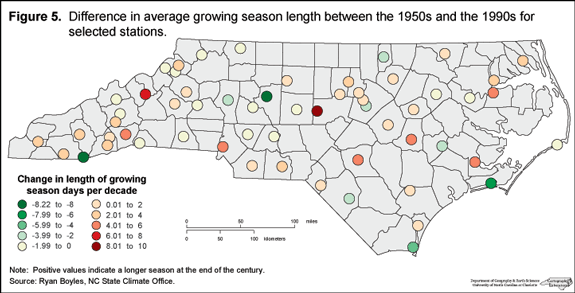
This review started with the statewide annual average conditions and indicated that the answer to the question of whether or not there has been warming was not simple. The same answer holds at the opposite end of the scale, when one considers individual stations. Some places have gotten warmer, some colder, and it depends on the time period, or the season, involved. This can be illustrated statewide by considering the length of the growing season over the last few decades (Figure 5). For most of the state the growing season is now a few days longer than it was in the middle of the last century. But for some places it seems to be well over a week longer, while for occasional stations, seemingly scattered at random, the season is now considerably shorter.
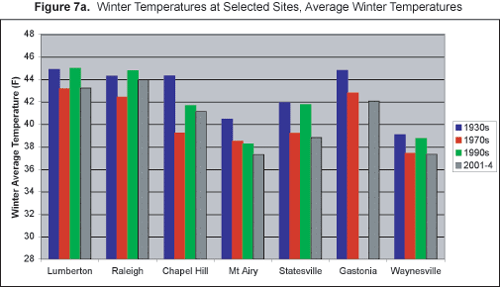
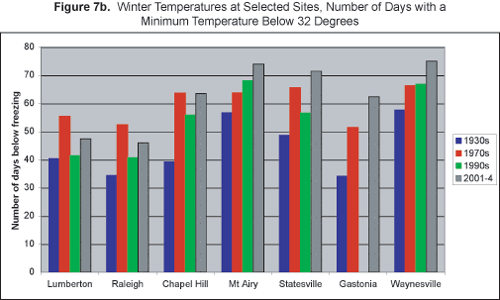
Some typical stations, chosen because they have a long reliable period of observations, illustrate most of the features found across the state. They all show the same broad variations in temperature with time as the state as a whole, but with much more year-to-year and season-to-season variability. Three recent decades illustrate the trends: the 1930s which had a generally warm period not too different from the present; the 1970s, which were cooler and the start of the current warming trend; and the 1990s, the last complete decade. The most recent observations for 2001-2004, are added for comparative purposes.
Starting with the average summer temperatures (Figures 6a & 6b), most stations show the clear dip of the cool 1970s. Mt. Airy had a different pattern, one that has continued into the present century, so that the station appears to have been cooling for a long period. The recent values for the other stations tend to be close to the 1990s, certainly with no evidence of a continued, or well marked warming trend. Waynesville, typical of its mountain region, has had very little summer temperature variation.
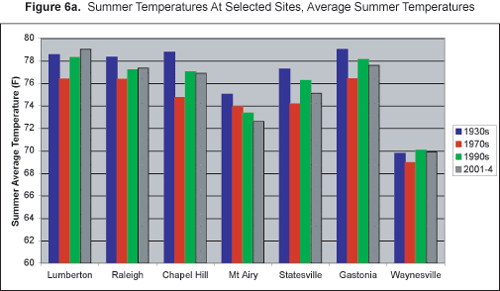
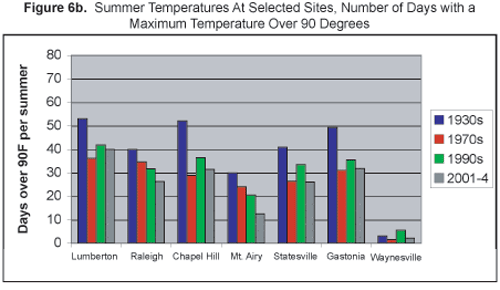
Although the summer average temperature of the 1930s was for most stations only slightly higher than that of the 1990s, there were many more days with maximum temperature over 90oF. Here, Raleigh in the 1990s seems to have had fewer hot days than would have been expected. And Chapel Hill and Raleigh, although geographically close, have very different climate variations. Indeed, one reason for choosing the two stations was to emphasize the differences which can occur over just a few miles. For the state as a whole, however, these station data suggest that the 1990s had a rather general warming, with all days pushed up a few tenths of a degree, whereas the 1930s were a time where there were more exceptionally hot days than normal.
The pattern of both winter average temperature and the number of days below freezing for these decades is as anticipated for all stations except Mt. Airy (Figures 7a & 7b). However, cold has returned for the first four winters of the new millennium, and average temperatures are down, the number of days below freezing are up.
With the observational data that is available for the state, it is theoretically possible to go on making ever more refined analyses of recent temperatures. But the general picture is clear. The surface temperature record for North Carolina over the last 100 years shows periods and areas of warming and cooling, sometimes felt through individual excessively hot or cold days, sometimes through small, consistent changes throughout a month or season. There is some indication of a cyclic nature to all this, which fits well with the seeming cyclic nature of some severe events, which are considered in the next section. What is going on for individual days and in some cases even what is going on in particular months and seasons can be largely explained meteorologically, in terms of jet streams, weather fronts, and high and low pressure areas. For the climate cycles lasting a decades or two, however, there is much less understanding. Oceans and their currents play a major, albeit now rather mysterious, role in this. Unfortunately one cannot make forecasts of North Carolina temperatures a decade or so into the future. The best that can be done is to project the recent past forward in time, using statistical methods to take general trends and cycles into account.
On the very broadest scale, North Carolina temperature fluctuations have been similar to those of the planet as a whole. It is currently suggested that the world-wide cooling seen during the 1940-70 period was, at least partly, the result of a build-up of pollution in the atmosphere, cutting out sunlight in the process called “solar dimming”. There is some evidence that this pollution load is now decreasing, possibly only on the short term, letting in more sunlight and increasing temperatures. At the same time, more and more climatologists are becoming concerned that increases in the greenhouse effect because of human actions are also leading to a warming. So it is expected that the planet will warm in the near future, although the amount is not certain. However, this is not the same as saying that North Carolina, or any part of the state, will automatically get warmer. The world-wide average warming will almost certainly lead to a sea level rise, with impacts on the coast. But the impact in inland areas is highly uncertain. All one can say with certainty at the moment is that the state's climate will change.

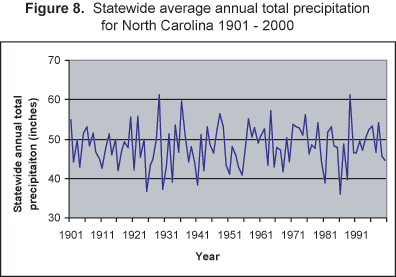
Precipitation is probably the climatic element of most practical concern to people although one often hears more about trends in temperature than trends in precipitation. There is relatively little information about precipitation trends, partly because their identification and complexity is worse than those of temperature. At the same time, the understanding of precipitation, even the day-to-day variations, is much less than for temperature. For the 20th century as a whole, there was no continuous trend when looking at the annual total precipitation averaged over the whole state (Figure 8). Unlike temperature, this lack of trend is not unique to North Carolina, and indeed, many places around the world show a similar pattern of wet periods interspersed with dry ones. For our area it is even difficult to suggest that there were certain decades which were particularly wet or dry. Great year-to-year variability seems to be the rule.
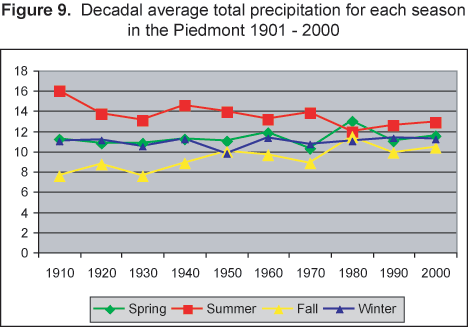
When one looks at the seasonal and regional picture of precipitation trends, patterns do emerge (Table 4).These are potentially very important differences. For much of the state, summer was over 10 percent drier at the end of the 20th century than it was at the beginning. Fall, however, has been getting considerably wetter, with some areas increasing their amounts by over 30 percent. Winter and spring have also increased their precipitation amounts, but generally to a lesser extent. When actual values (Figure 9) are considered the effect has been to produce a much more even distribution of rainfall throughout the year. Summer, originally by far the wettest season, and Fall, the driest, are now almost equal.

These differences can have a major impact on the occurrence of drought and on water supplies. Drier summers almost automatically mean that summer droughts are more frequent. These influence agriculture directly, increasing the need for irrigation water. Much of this, especially in the eastern part of the state, must come from underground sources. These underground sources have to be replenished once the growing season is over if water is to be available the following year. A wetter fall, however, does not automatically provide the extra water needed to compensate for the summer drought. Water can only percolate slowly through the soil, which may easily become saturated when there is plenty of rain. Once that happens, the rain can only run off into the rivers. So, much of the Fall rainfall increase becomes extra run off. Some of that may be saved in reservoirs, but most simply flows to the ocean and so is of no help if there is a drought coming next year.