Drought
by Peter J. Robinson
University of North Carolina at Chapel Hill, Department of Geography
Reprinted with permission from the North Carolina Atlas Revisited. Managing editor: Alfred W. Stuart.
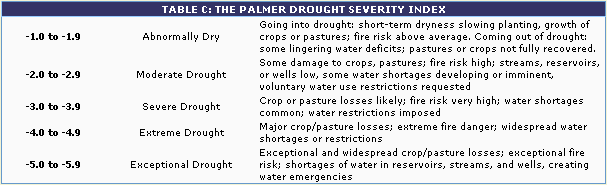 Drought may be, rather obviously, the opposite of floods, but it is much more difficult to define and detect. It is something which seems to creep up on people and they hardly recognize it until it is already well established. There is no real nation-wide definition since drought depends not only on the average rainfall expected in any area, but also the common year-to-year rainfall variability in the area. Further, whether or not a drought occurs depends on whether one is worried about agriculture, construction, energy generation, water supply or forest fire danger. Consequently, several ways of measuring drought have been developed, none of them completely satisfactory for all regions or all impacts. One measure for which there is a long, detailed record, is the Palmer Drought Severity Index (PDSI, shown to the right in Table C). Although nationally this emphases agricultural drought, in North Carolina it is a good general measure for most impacts. This Index indicates that drought was virtually absent during the first decade of the 20th century, to be followed by a slow increase into the 1920s (Figure 15). That decade was much drier than the following one, the Dust Bowl years which devastated the mid-section of the nation. The droughts of the 1930's may have been less severe here, but nevertheless both decades had significant impacts on a rural, agricultural state, particularly since there was no Federal safety net for the farmers affected. Frequent droughts continued throughout the '40s and '50s and then almost vanished for the 1960s and '70s. The 1980s again had droughts while the '90s were wet. There was, however, another trend during those 100 years. Early in the period the mountains were much less susceptible to drought than the rest of the state. By the end they had become the most likely place to get drought.
The recent major drought (Figure 16) was most marked in the mountains. A long period of below normal rainfall began there in the summer of 1998. This expanded to include parts of the Piedmont the following winter, and parts of the Coastal Plain by the summer of 1999. It was never a severe drought outside the mountains, and the rains of hurricanes Dennis and Floyd easily broke it in the Piedmont and almost literally washed it away on the Coastal Plain. Meanwhile, in the mountains the drought continued and got worse. In October 2000 the PDSI fell below -3, signaling the onset of a severe drought. Stream flow was extremely low, groundwater was becoming scarce and there was a growing need to reduce water use. This continued almost unchanged for a year or so. Starting near the end of 2001 the drought area expanded to include virtually the whole of the state. By the summer of 2002 much of it was in extreme drought (PDSI <-4, and precipitation for the last 6 months being less than 60 percent of normal). Virtually everywhere had problems obtaining water for human and agricultural use (Figure 16). In September, 2002 abundant rain finally came to the mountains after a period of over four years with low rainfall and water problems. The Coastal Plain was also wet at this time, but over the Piedmont the extreme drought persisted from another month before abundant rain ameliorated the water problems.
This recent drought was one of the top three in the last 100 years. Previous to this was one in 1986 which was of shorter duration but even more intense. It started in the southern mountains early in the year, expanded to affect the whole state between May and October, and then died away rather rapidly. Between June and September the southern mountains had PDSI <-5 (an exceptional drought, associated with rainfall in the previous 12 months being no more than 65 percent of normal). In July, 1986 the whole of the southern mountains and Piedmont were below -5, the most intense drought month of the century. There was a rather shorter, and perhaps even more intense, drought in the winter of 1933-34, when the whole of the Piedmont had PDSI below -5 for a month. But probably the severest drought in our record was that between September, 1926 and June, 1927. All of the state outside the mountains had PDSI below -3 in this period, with much of the Coastal Plain below -4. For much of the southeast of the state the severe drought persisted almost to the end of the year. And this drought came hard on the heels of one lasting from July, 1925 until January, 1926.
There appears to be no pattern in the timing of these major droughts, but it is common in the North Carolina climate for late summer and early fall to be the time when agricultural drought and water resource problems are quite likely in most years. This results from a combination of two factors. First, because rainfall is fairly evenly distributed throughout the year while evaporation reaches a maximum in the heat of summer, there is a natural tendency for more water loss in summer. So the water available, whether in the soil, deeper in the ground, or in stream flow, is least around summer's end. Second, summer rainfall is much more variable from year to year than is that of winter. This can be attributed mainly to the action of the Bermuda High, a local feature of the global atmosphere. This is an anticyclone, a more-or-less circular region of high pressure with surface winds spiraling out in a clockwise direction. The weather of an anticyclone is the opposite to that which would be expected from a typical rain-bringing storm, having light winds, no weather fronts, and actively discouraging the formation of clouds and rain. In winter the Bermuda High is over the Atlantic Ocean away to our southeast, but in summer it moves north to a center very roughly over the island of Bermuda. While there it plays a minor role in weather but in most summers it either expands or drifts eastward, or both, to affect more people. While it is overhead there is no rain. If it stays for a week or so there is a nice break from summer rains; if it stays much longer it begins to get dry. Sometimes it stays for much of the summer and, if so, there is a major problems with drought. Often, as in 1999, it takes a hurricane to come and in and push it away to break the drought.
References and additional resources:
NCpedia ANCHOR on droughts.
Lost Colony & Jamestown Droughts (NOAA): https://www.ncei.noaa.gov/products/paleoclimatology
NC LIVE resources on droughts in NC.
Orr, Douglas Milton, and Alfred W. Stuart. 2000. The North Carolina atlas: portrait for a new century. Chapel Hill: University of North Carolina Press.
Resources on drought in NC in libraries [via WorldCat]
Robinson, P. J. 2005. North Carolina weather & climate. Chapel Hill, NC: Published in association with the State Climate Office of North Carolina by the University of North Carolina Press.
State Climate Office of North Carolina.
State Library and State Archives Digital Collections.
Stuart, Alfred W. The North Carolina Atlas Revisited. 2005.
1 January 2005 | Robinson, Peter J.